U.S. Immigration Quotas
Interpreting Data
All documents and text associated with this activity are printed below, followed by a worksheet for student responses.Introduction
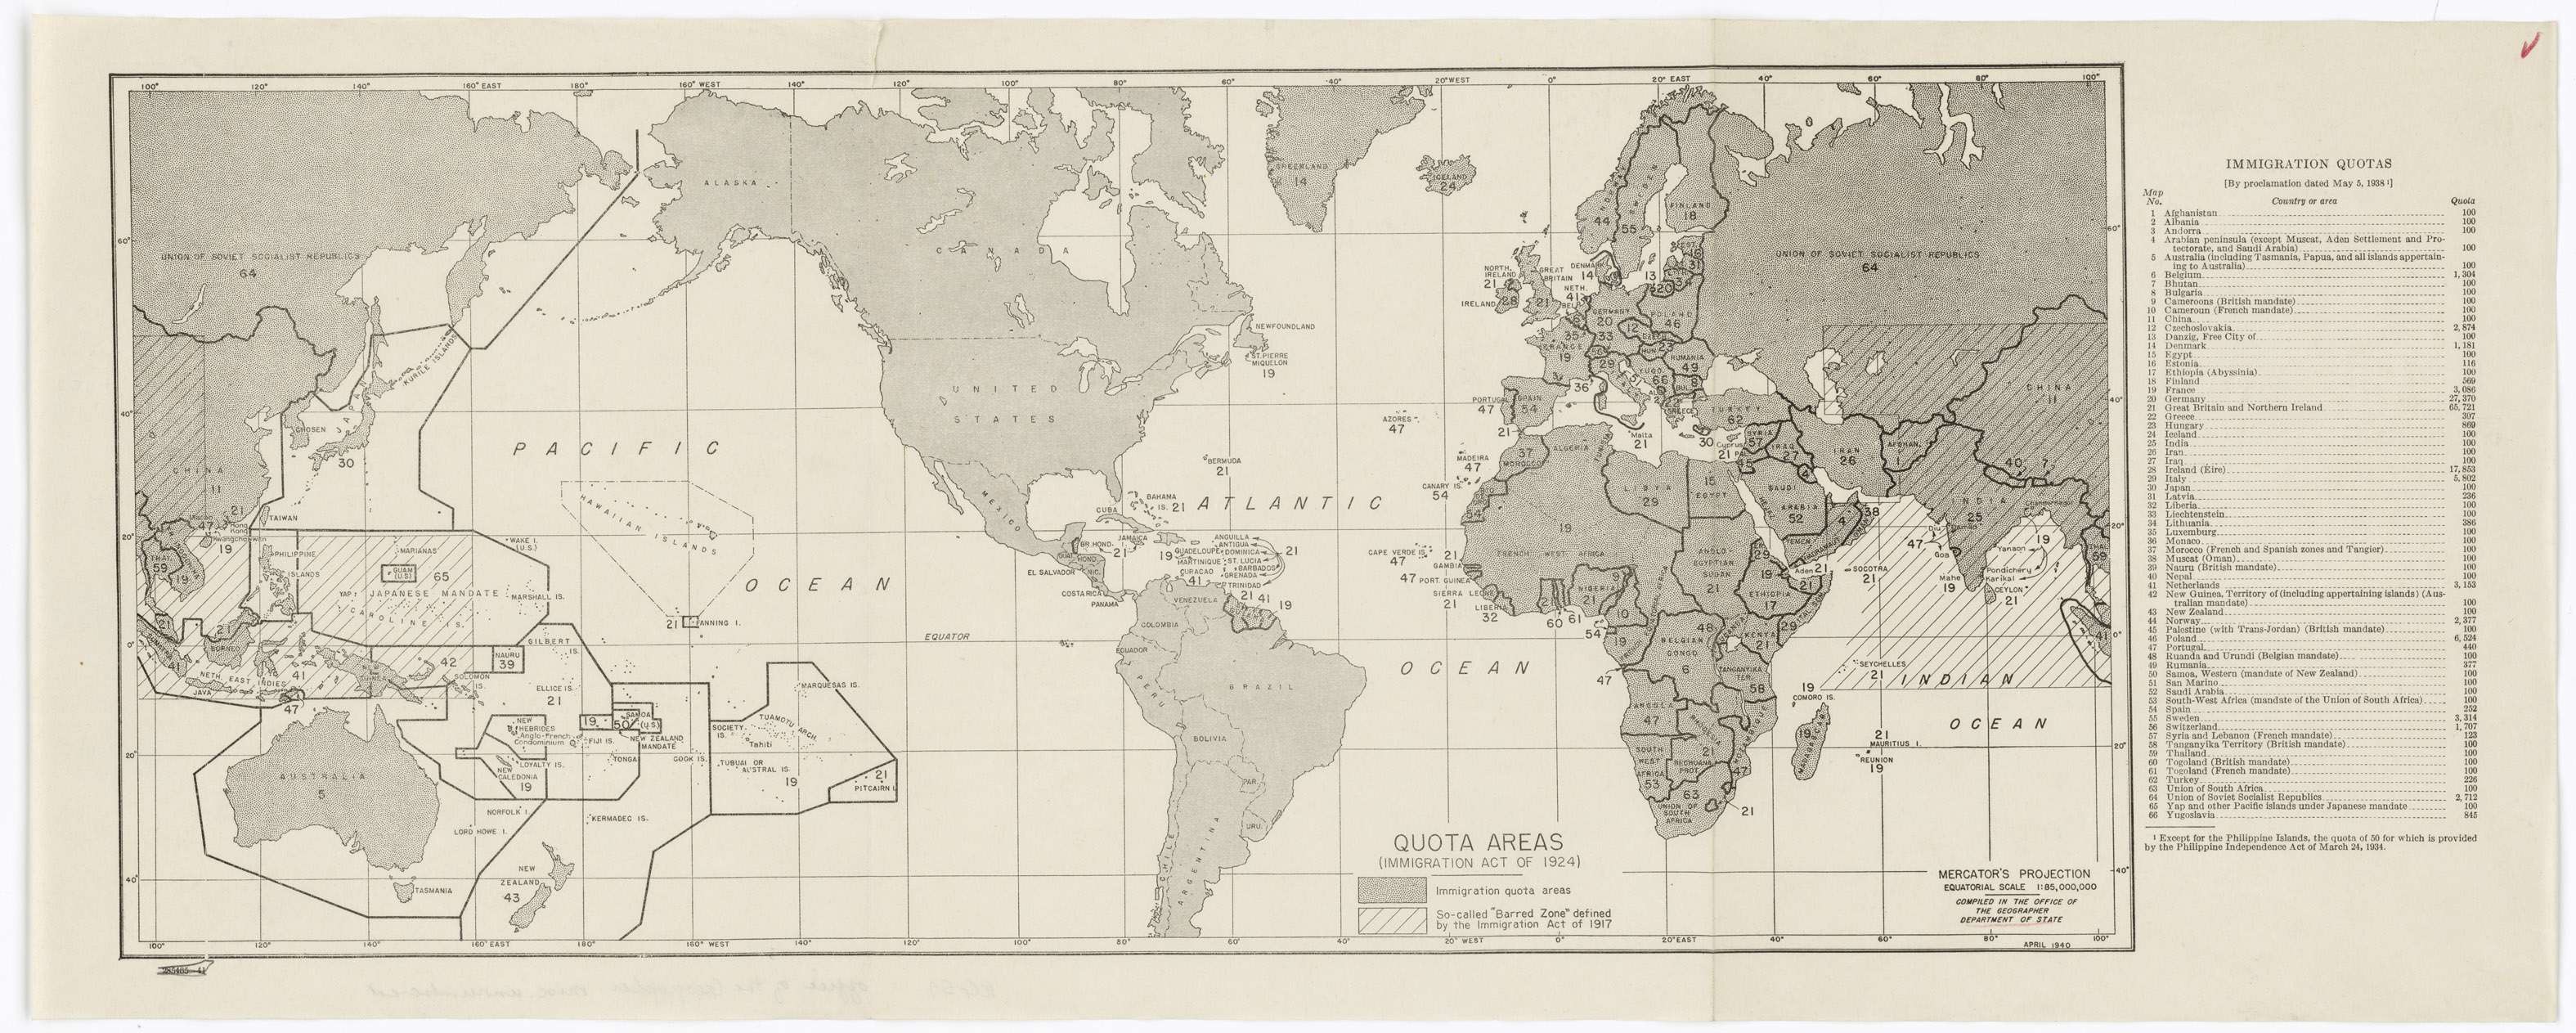
The Immigration Act of 1924, also known as the Johnson-Reed Act, created quotas designed to limit immigration into the United States from countries considered to be undesirable. It limited immigration to 2 percent of that nationality already living in the United States in 1890, as recorded by census takers. This meant that the largest national groups in the United States in 1890 received larger quotes in 1924. Quotas for groups that immigrated after 1890 had much lower quotas.This map was issued in 1940 to illustrate President Franklin D. Roosevelt's proclamation (of 1938) reaffirming quotas from the 1924 act. It provides an opportunity to look into a period of demographic, economic, and social challenges for the United States.
Take a few minutes to study the map. Click on the "i" buttons to focus on particular sections, and to read questions that will help you analyze the map. After you've studied the map, click on "When You're Done."
Name:
Class:
Class:
Worksheet
U.S. Immigration Quotas
Interpreting Data
Examine the document or documents below. Use the numbers to refer to the questions or hints provided. Then label the documents(s) with additional numbers or symbols based if you were asked to do in the introduction and explain them in the margins. Write your conclusion response in the space provided.
1
2
Number: 1
Notice the "barred zone." Which nations were barred from immigrating to the U.S. by the Immigration Act of 1917? Think about what the reasons might be.
Number: 2
Review this list. Which parts of the world have the largest quotas? Which have the smallest? Which have the minimum of 100? (The 1924 act set the minimum quota at 100.)
1
Activity Element
Quota Areas, Immigration Act of 1924
Page 1
Conclusion
U.S. Immigration Quotas
Interpreting Data
- What does this map demonstrate about attitudes toward immigrants in the 1920s, 1930s, and 1940s?
- What was happening in America and in the world during that period that might provide context to these numbers?
- What questions do you have about the quota numbers?
- What impact do you think the immigration restrictions had on the demographics and the cultural, ethnic, and religious makeup of the United States?
Your Response
Document
Quota Areas, Immigration Act of 1924
4/1940
This map (produced in 1940) shows immigration quotas by country as set by the Immigration Act of 1924.
In 1921, the Emergency Quota Act had limited immigration by setting a limit on the number of people admitted from each country. Three percent of that nationality already living in the United States according to the 1910 census would be allowed entry per year.
The Immigration Act of 1924 further restricted immigration. It established the 1890 census as the new base for determining how many immigrants would be admitted and reduced the percentage admitted to 2 percent. Since the foreign-born population of the United States was much smaller in 1890 than in 1910, immigration was more restricted than it would have been by a simple reduction of the base percentage.
People from the Western Hemisphere were exempt. Fewer southern and eastern Europeans, and more northern and western Europeans, were permitted entry. The annual ceiling was lowered from 387,803 to 186,437 immigrants, and visas with photographs were required.
This primary source comes from the General Records of the Department of State.
National Archives Identifier: 7460041
Full Citation: Quota Areas, Immigration Act of 1924; 4/1940; Maps of Foreign Areas, 1941 - 1944; General Records of the Department of State, ; National Archives at College Park, College Park, MD. [Online Version, https://www.docsteach.org/documents/document/quota-areas-1924, April 19, 2024]Quota Areas, Immigration Act of 1924
Page 1