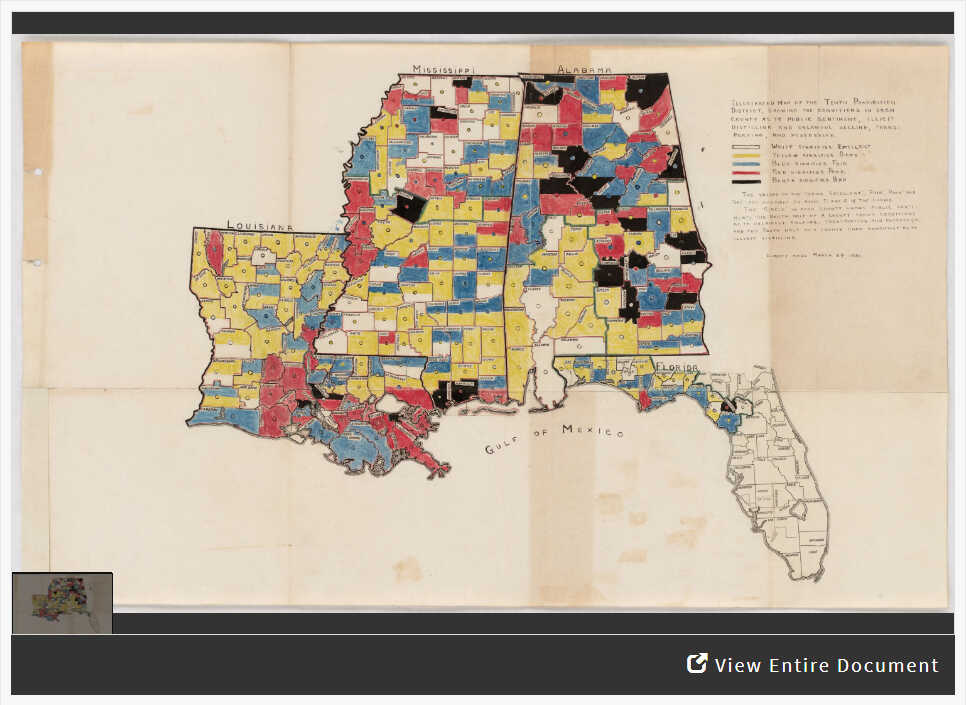
In this activity, students will go through the process of document analysis to better understand a Prohibition Era map. The map contains data about the level of public support for Prohibition and how well counties were adhering to Prohibition rules. After analyzing the map, students will try to explain the challenges of enforcing prohibition laws.
Suggested Teaching Instructions
This activity is appropriate during a unit on the Roaring Twenties and/or an evaluation of the Prohibition Era. For grades 5-8. Approximate time needed is 20 minutes.
Students can complete the activity individually, in pairs, or as a full class. Begin with a brief discussion of Prohibition Era bans on alcohol. Ask or inform students what the 18th Amendment and the subsequent Volstead Act (National Prohibition Act) specifically banned related to alcohol:
- The 18th Amendment states that "...the manufacture, sale, or transportation of intoxicating liquors within...the United States...is hereby prohibited."
- The Volstead Act provided an enforcement apparatus for the amendment. It set a strict limit on alcohol content of .5 percent; criminalized the manufacture and sale (but not the consumption) of alcoholic beverages; and allowed for home manufacture and alcohol for medicinal and religious use. It also set stiff penalties for violations. A first conviction could result in a fine up to $1,000 and imprisonment up to six months. Property used in breaking the law could be seized.
Direct students to begin the activity by taking a minute to examine the map.
This map shows sentiment about Prohibition in each county of the "Tenth Prohibition District," including Louisiana, Mississippi, Alabama, and part of Florida. It was created for a report on Federal Prohibition enforcement. The different colors depictlevels of public support for Prohibition and how well each county was adhering to Prohibition rules. From the perspective of law enforcement, white represents "excellent"; yellow is "good"; blue is "fair"; red is "poor"; and black is "bad."
Students should answer the questions below the map, which will guide them through the process of map document analysis. If necessary, check in with your students at each step in the process and model analysis if required:
- Meet the document.
- Observe its parts.
- Try to make sense of it.
- Use it as historical evidence.
After students have answered all of the analysis questions, they should click on "When You're Done." Facilitate a class discussion based on the question:
- What does this map reveal about the effectiveness of enforcing Prohibition legislation? Explain using specifics from the map.
For example, students may cite the abundance of black, red, and blue counties, indicating low levels of public support for Prohibition and a lack of adherence to Prohibition rules. They may reference how few white counties there are. Or they may note the clusters of counties with low levels of public support.


