Map of Virginia Showing the Distribution of its Slave Population from the Census of 1860
1860
Add to Favorites:
Add all page(s) of this document to activity:
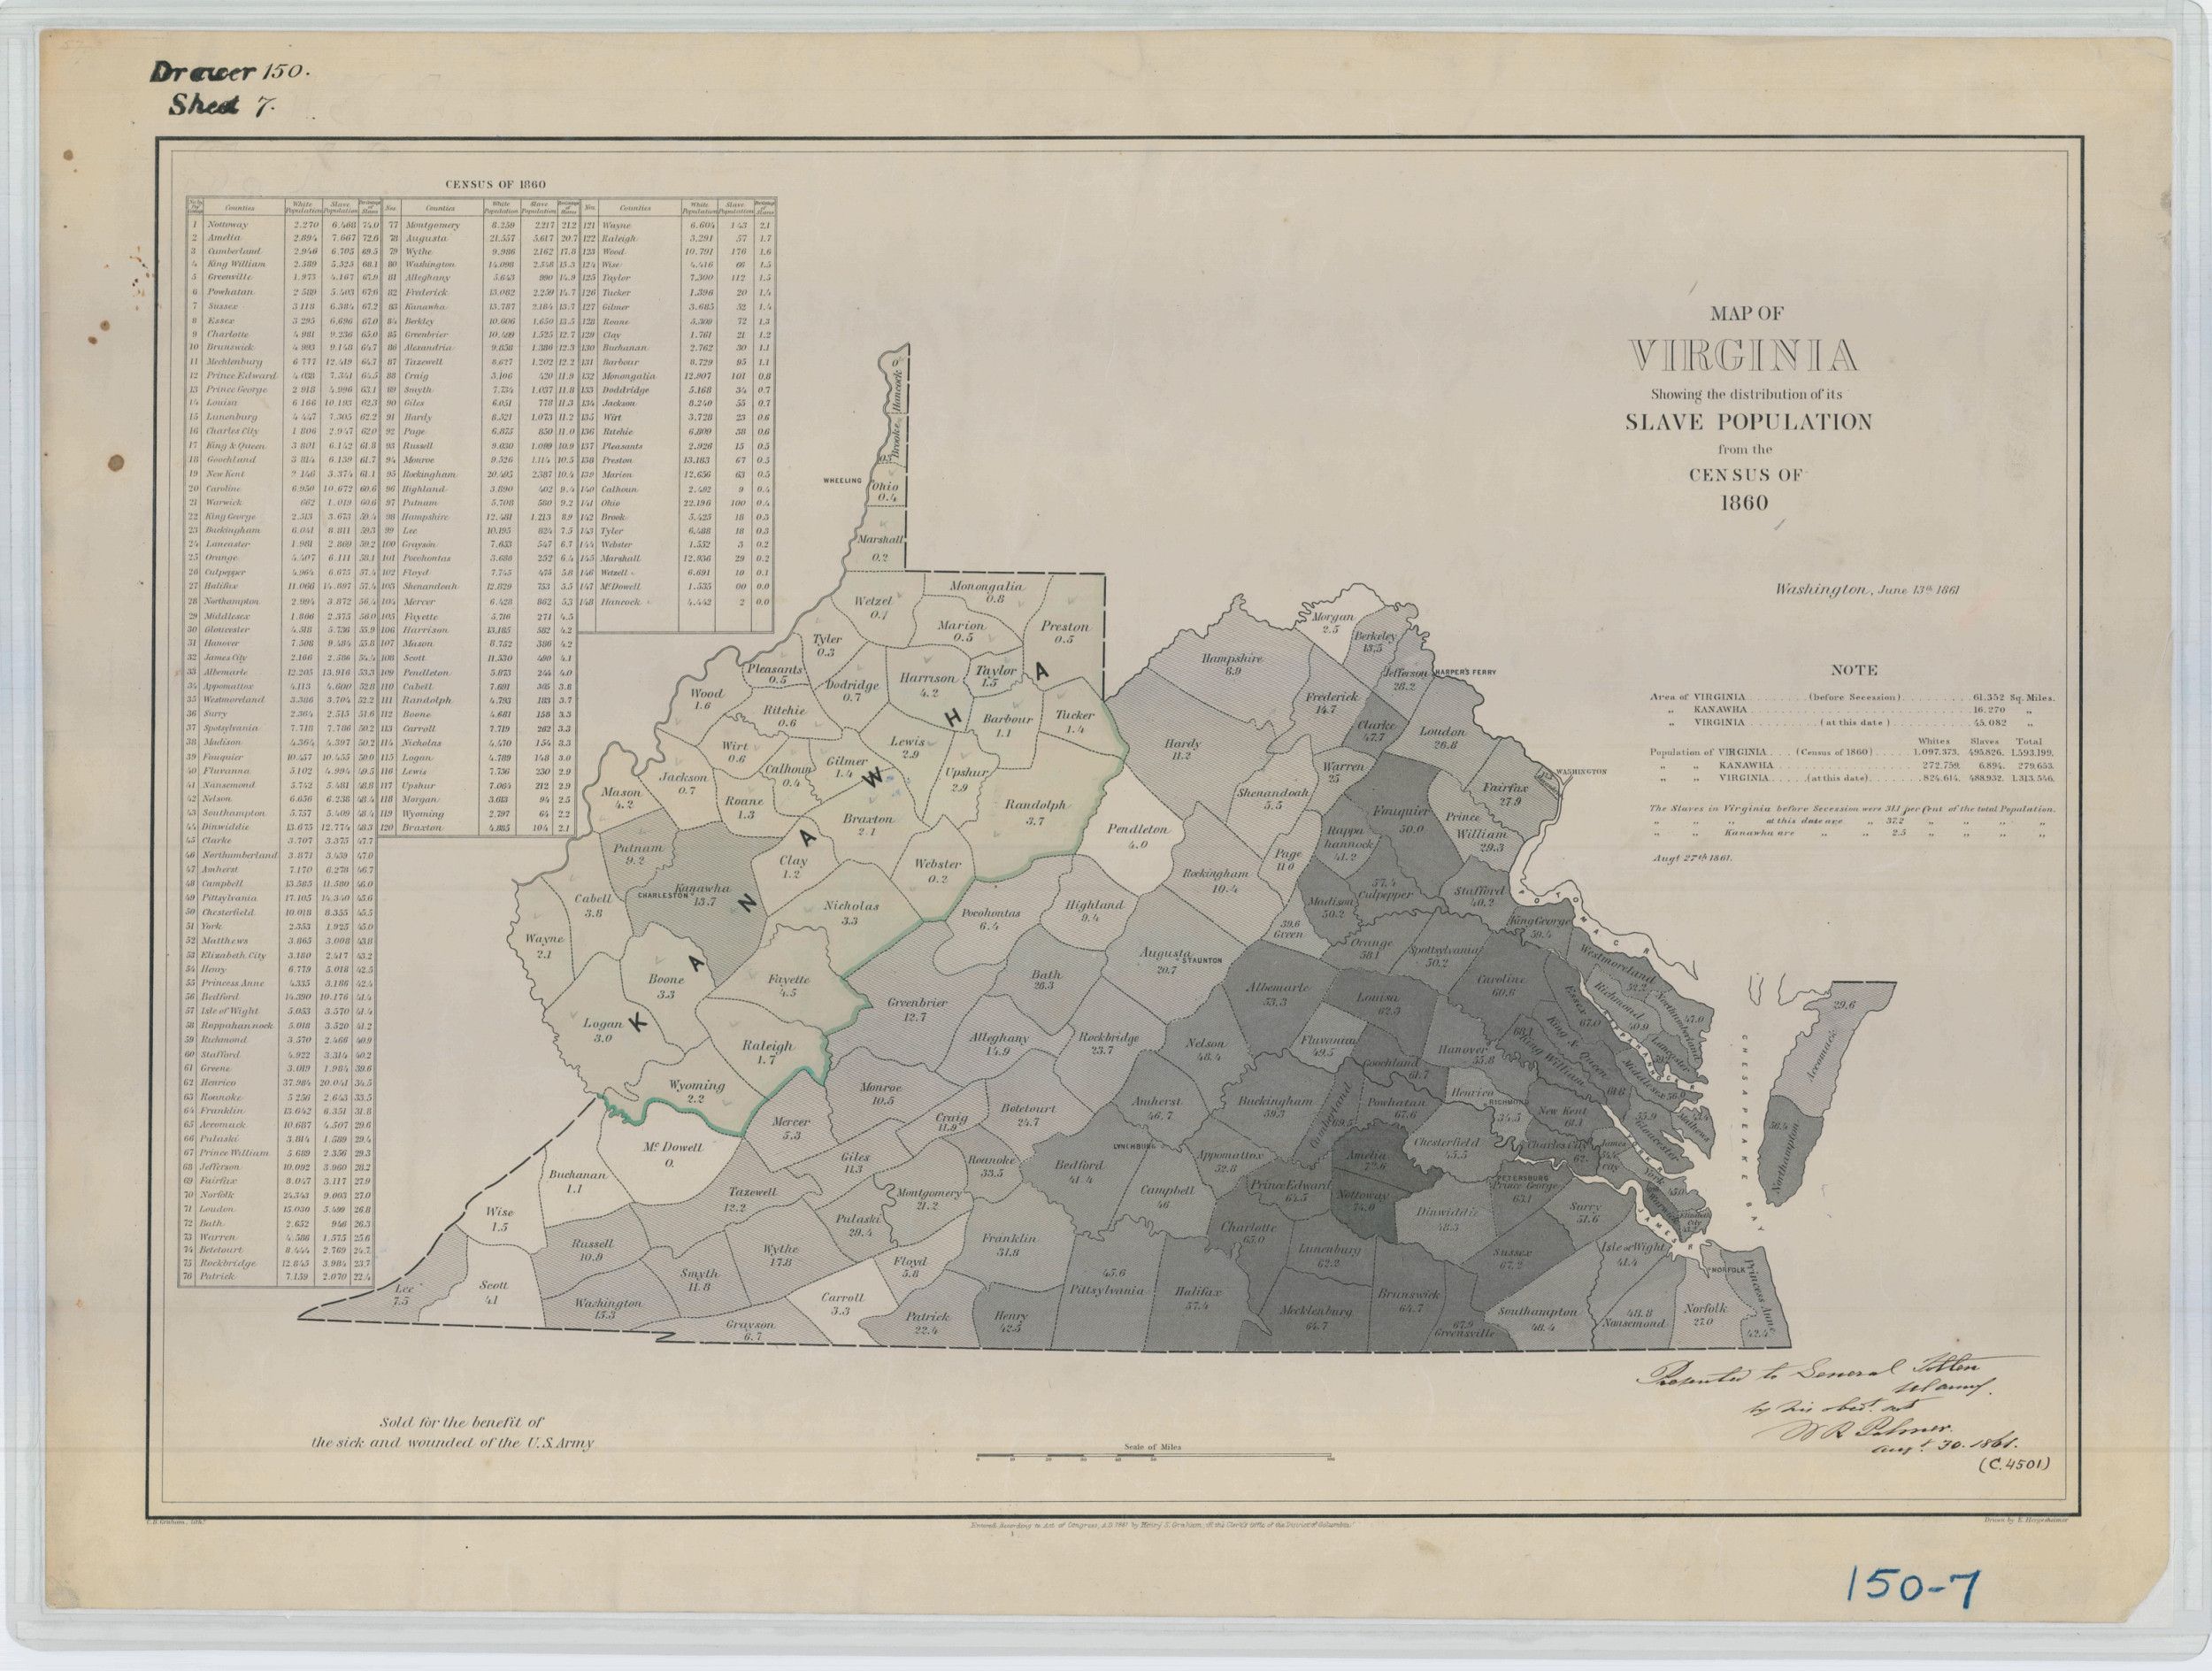
This map was important to illustrate the unequal distribution of enslaved persons in the eastern and western counties of Virginia. This particular version of the map was modified to include Kanawha, the western part of the state of Virginia, which is shown in light green. The map shows the smaller percentages of enslaved persons living in the western portion of the state versus the eastern portion. This issue, in part, led the western counties of Virginia to breaking off and form the new state of West Virginia in 1863.
This primary source comes from the Records of the Office of the Chief of Engineers.
National Archives Identifier: 6860733
Full Citation: Map of Virginia Showing the Distribution of its Slave Population from the Census of 1860; 1860; Records of the Office of the Chief of Engineers, Record Group 77. [Online Version, https://www.docsteach.org/documents/document/map-of-virginia-showing-the-distribution-of-its-slave-population-from-the-census-of-1860, April 25, 2024]Rights: Public Domain, Free of Known Copyright Restrictions. Learn more on our privacy and legal page.
