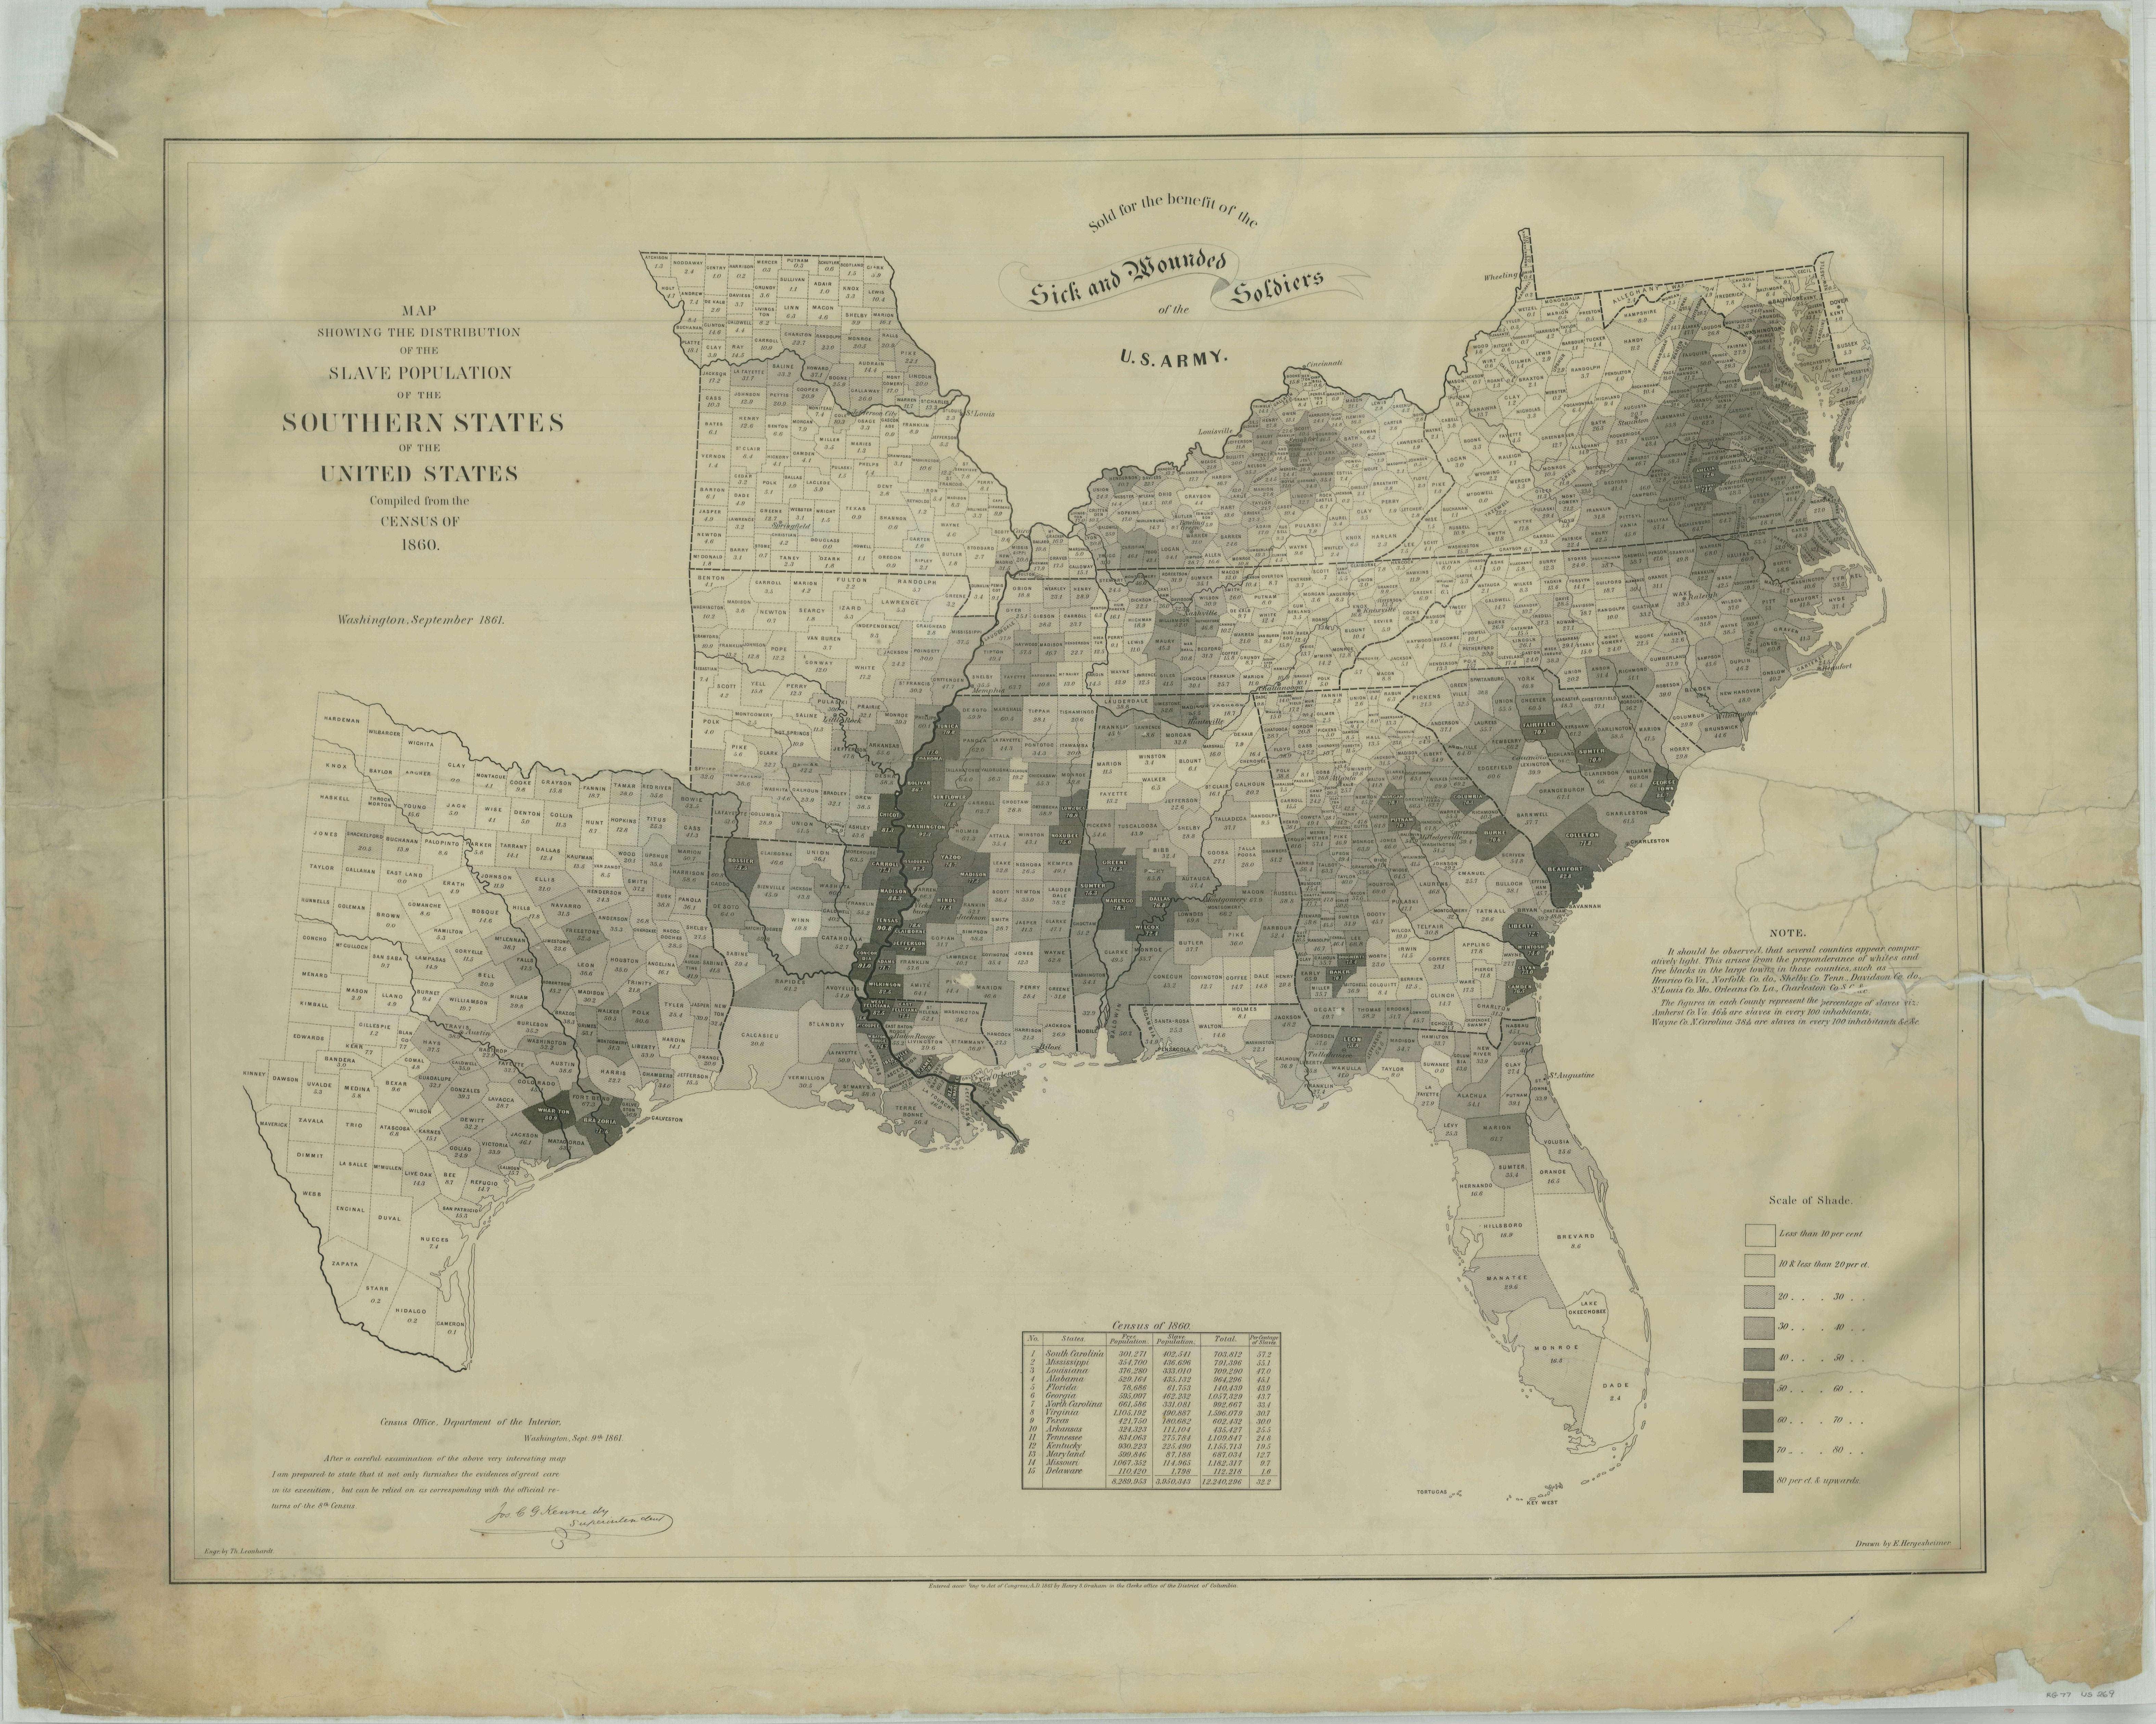
Map Showing the Distribution of the Slave Population of the Southern States of the United States
1861
Add to Favorites:
Add all page(s) of this document to activity:

This map represents one of the first American attempts to translate census data into a visual representation on a map. It was created in 1861 by the U.S. Coastal Survey using statistical data from the 1860 census.
The map shows the percentage of enslaved people by county, with different colors reflecting the percentage. It provides a visual picture of how enslaved persons were distributed across the Southern States.
It was reported to have been a favorite map for President Abraham Lincoln to consult during the Civil War, and is depicted in Francis Bicknell Carpenter’s famous painting “First Reading of the Emancipation Proclamation of President Lincoln.”
This primary source comes from the Records of the Office of the Chief of Engineers.
National Archives Identifier: 86455714
Full Citation: Map Showing the Distribution of the Slave Population of the Southern States of the United States; 1861; United States; Civil Works Map File, 1818 - 1947; Records of the Office of the Chief of Engineers, Record Group 77; National Archives at College Park, College Park, MD. [Online Version, https://www.docsteach.org/documents/document/map-slave-population-of-southern-states, April 18, 2024]Activities that use this document
- 1860 Slavery Map of the United States
Created by the National Archives Education Team
Rights: Public Domain, Free of Known Copyright Restrictions. Learn more on our privacy and legal page.
