In this analysis activity, students will place maps of congressional districts from around the United States that were created after the 2010 Census on their corresponding state on a U.S. map. Students will explore these maps to understand the extent of "gerrymandering" that can occur in congressional representation.
Suggested Teaching Instructions
This activity is intended for a unit on congressional representation, civics, or gerrymandering. For grades 6-12. Approximate time needed is 45 minutes.
To begin, ask students about Congress and the differences between representation in the Senate and the House of Representatives. Ask students if they know how many members are in the Senate and the House of Representatives for their state and the country. Remind students of the Great Compromise during the Constitutional Convention that created a bicameral legislature – one based on population (House of Representatives) and one based on equality between the states (two per state in the Senate).
If necessary, explain the following:
Since 1929, the House of Representatives as been fixed at 435 members (when the Permanent Apportionment Act set this as the maximum number of representatives). Every ten years – following the results of the decennial Census – the number of House members representing each state is subject to change. States that experience a higher population growth may gain seats in the House of Representatives, while those that experience a population loss, or just a lower population growth, lose seats in the House of Representatives.
When this occurs, either the state legislature, an independent commission, or another group draw up new districts to accommodate the additional seats in Congress. Even within states that did not gain or lose representation, changing population trends within the state lead to newly shaped Congressional districts as each congressional district must have roughly the same population within a state.
To illustrate how districts can be drawn several different ways, share a copy of piece of paper with 20 random circles on it. Ask students to create five districts with four circles in each. Tell them to repeat this process several times. Finally, ask students to divide the paper into five districts in the most illogical manner. Invite several students to share their examples and the major differences between their versions.
Explain to students the idea of "gerrymandering" and its origin in the early 1800s. Explain that when political parties (typically through state legislatures) are directly in charge of redrawing districts, they often try to give their party an advantage. They can do this by "cracking" – distributing the other political party's voters into multiple districts which dilutes their voting power, or by "packing" – concentrating the other party's voters in one district, thus reducing their voting power in other districts.
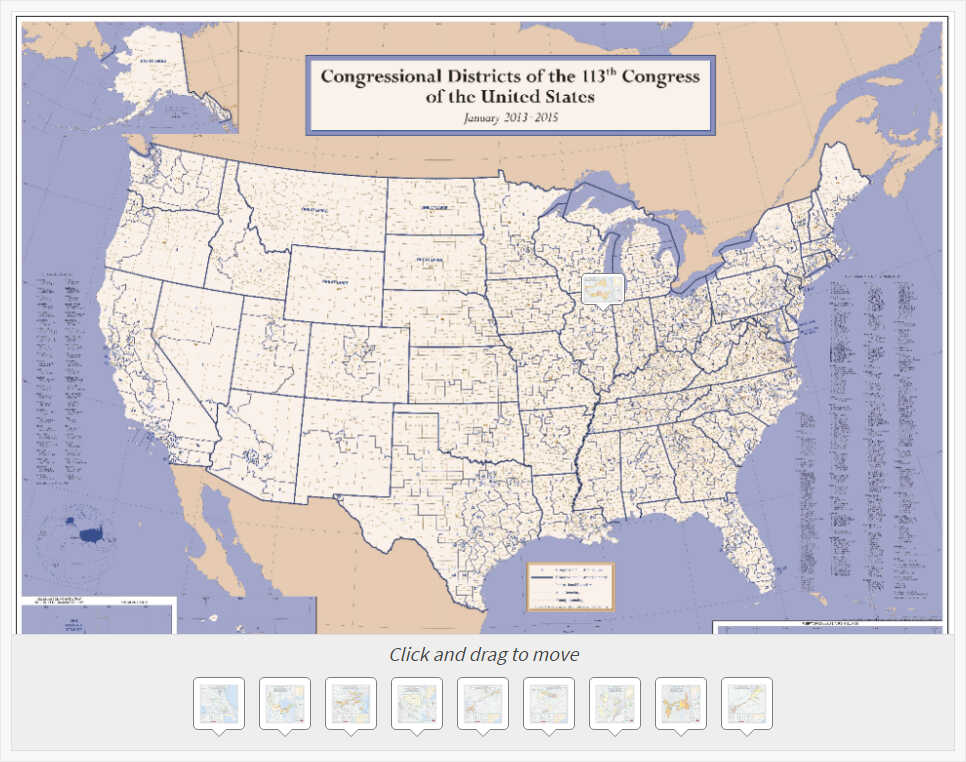
Display for students the map and documents. Inform students that the Illinois 4th Congressional District Map has already been placed in its correct location, while others need placing on the United States map. Model document analysis. Zoom in and around the congressional district map, noting details like cities, counties, and the detail state map. Ask students to share their opinion about the shape of the district. Ask students to explain why the district was drawn in that particular shape.
Next, instruct students to begin the activity, individually or in pairs, by looking at the congressional district maps below the U.S. map. (Clicking on the orange "open in new window" icon will allow them to see a larger version.) They should analyze each map carefully and determine the correct state. They should also note to what extent the district is gerrymandered based on its shape.
After students have placed all the maps, direct them to the "When You're Done" section. Begin a discussion based on the following questions:
- Which congressional district do you feel is the most gerrymandered? Why?
After discussing their opinions, tell students that several of these districts were later redrawn between the Census years after court decisions because they were considered too gerrymandered:
- Florida's 5th Congressional District
- North Carolina's 1st Congressional District
- North Carolina's 4th Congressional District
- North Carolina's 12th Congressional District
- Pennsylvania's 7th congressional district